

Bhubaneswar: Even as the Niti Aayog Fiscal Health Index report has patted Odisha for consistently maintaining its numero one position in overall fiscal health, it brings out another facet to the fore.
The Niti Aayog report released Friday shows Odisha lagging behind in the all-important ratio of total developmental expenditure vis-a-vis total expenditure.
When the State is in dire need of public infrastructure such as – Health centres, schools, roads, waste recycling, drains (storm and waste water), Niti Aayog report reveals State spending less than a host of states in the country.
As per the report, the ratio of total development expenditure to total expenditure in Odisha stood at around 65%. The report reveals the State lagging behind the following states.
DEVELOPED STATES SPEND MORE
A glance at the report shows when Odisha needs more expenditure on development indices to witness rapid progress of the State, developed states, having bigger budget size than Odisha, have been found spending more on development than Odisha.
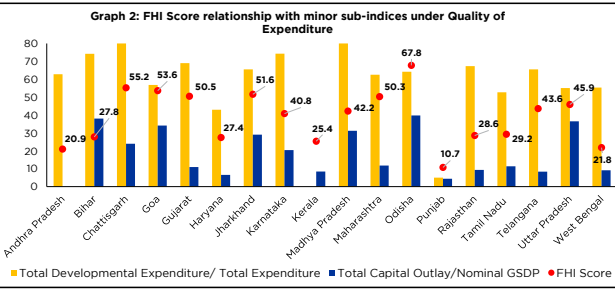
As a consequence, the Niti FHI report stated that the high index value of Total Developmental Expenditure to Total Expenditure for Chhattisgarh has contributed to a high FHI score
THE GOOD INDICES
The Niti Aayog report, however, reveals that, though, the State finishes behind 8 states in spending on development indices, when the requirement has been higher for Odisha, in another vital indicator of total capital outlay to nominal GSDP (real GDP + inflation), the State tops the country. (see the above image-blue bar).
The Result: The high index value of Capital Outlay to GSDP for Odisha has played a key role in achieving a high FHI score.
NITI HINTS BIG
The reports says, “It has been observed index value for quality of expenditure in terms of Developmental Expenditure and Capital Outlay ratios for Madhya Pradesh is higher than Chhattisgarh, but the FHI score for Chhattisgarh is higher than Madhya Pradesh. This indicates the significant contribution of other factors to the FHI score of Chhattisgarh, such as better performance under Revenue Mobilization, lower Fiscal Deficits, and lower Debt/GSDP ratio.”
The above inference of the Niti Aayog FHI report states the Chhattisgarh and Odisha are faring poorer than Madhya Pradesh in quality of development expenditure and capital outlay.
This is the BIG reason behind why despite high Capital outlay and more development spending, Odisha fares poorer than Madhya Pradesh in public and social infra.
NITI GLARE ON BLIP
The FHI report released by Niti Aayog reveals another reveals the secret behind the State's recid of low fiscal deficit and high revenue surplus.
As per the report, Odisha tops the country in the indicator of share of State’s own revenue (tax + non-tax) to nominal GSDP.
However, when it comes to funding total expenditure, Odisha's own tax revenues account for nearly 60% of toatl expenditure vis-a-vis the developed states like Gujarat, Haryana, Karnataka, Kerala, Maharasthra, Telangana and Tamil Nadu - where the own tax revenue contribution in total spending is far higher than Odisha.
This indicator shows Odisha's heavy dependence on Central government and market borrowings to fund its expenditute - revenue and capital.
(see the image below – blue bar)
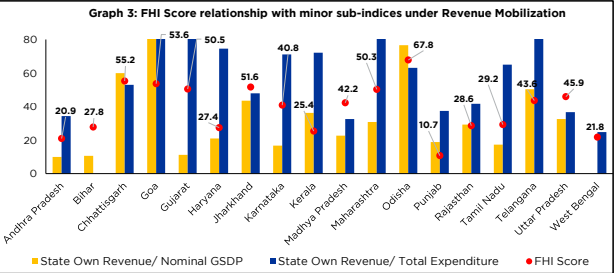
The above facts hint big
OTHER BIG TAKE AWAYS