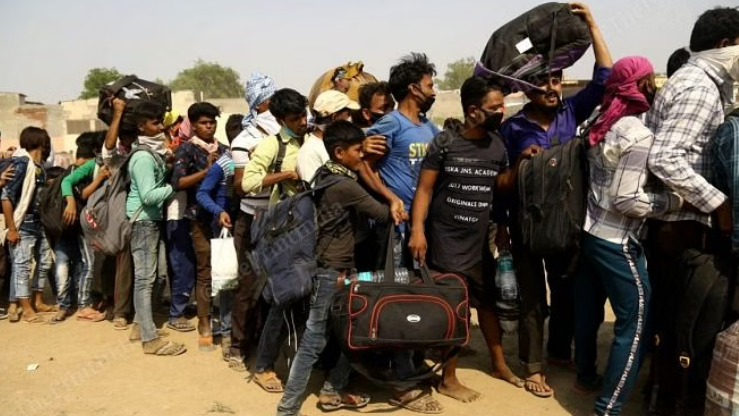
Bhubaneswar: When outbound migration from State has been a major poll issue in the last General Election, a study report by Prime Minister Economic Advisory Council (PMEAC) has dropped a big shocker for Odisha.
The working paper titled “400 million Dreams” has revealed a fall in total domestic migration in the country in the last 10 years.
As per the report, the overall domestic migration in India has slowed down in last decade (2011-2023).
The report has estimated the overall number of migrants in the country, as of 2023, at
- 40,20,90,396 or 40 cr or 400mn
- Report says this is about 11.78% lower as compared to the number of migrants enumerated as per Census 2011
- In Census 2011, the total domestic migrants were estimated at – 45,57,87,621(45cr or 450mn).
- The report says, consequently, Census 2011 migration rate that stood at 37.64% dropped to
- 28.88% of the population in 2023.
- THE REASON: The PMEAC report attributed the drop to availability of improved services such as education, health, infrastructure and connectivity as well as improved economic opportunities in or near in major sources of migration.
HOW PMEAC ESTIMATED WITHOUT CENSUS 2022 DATA?
The working paper authored by former chairman of PMEAC late Bibek Debroy and Director PMEAC, Devi Prasad Mishra has been released recently.
The working paper has been released by the PMEAC recently, when the lead author and former Chairman PMEAC Bibek Debroy passed away on Nov 1, 2024.
As per the authors, they have arrived at the above conclusions on domestic migration by taking the Census 2011 migration data as base, and then hypothesised the 2023 numbers by taking into account the 2012 and 2023 the following.
- Unreserved Ticketing system – means passenger travelling on trains with the second class ordinary ticket (unreserved) – from Indian Railways.
- Visitor Location Register data from TRAI
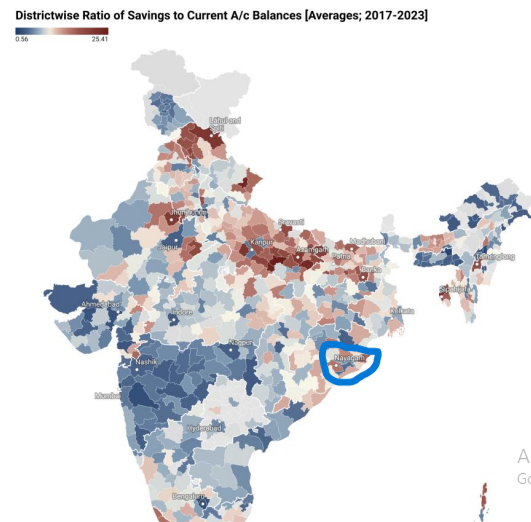
- District wise ratio of saving to current account deposits from RBI annual banking data.
INDIA MIGRATION RESULTS
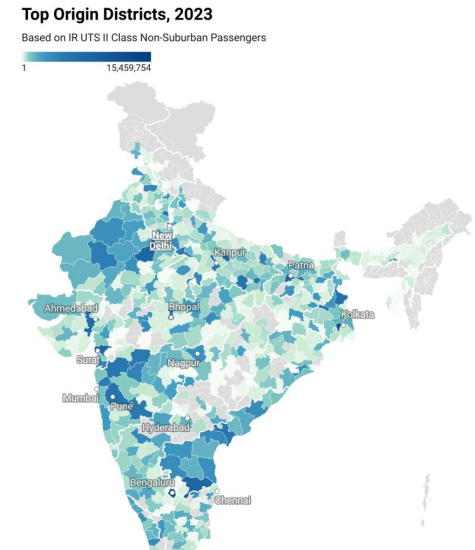
- The study after looking at the spatial dimensions of travel, finds that the top origin districts are coalesced around major urban agglomerations viz.
- Delhi,
- Mumbai,
- Chennai,
- Bangalore,
- Kolkata
- OTHER FINDIGS ARE:
- Short distance migration accounts for the largest share of migrants.
- The composition of the top five recipient States attracting migrants [including intra-State migrants] has changed.
- West Bengal and Rajasthan are the new entrants and
- Andhra Pradesh and Bihar are now ranked a notch lower.
- Even amongst the top five recipient States the percentage of predicted migrants headed to the respective States has reduced.
- West Bengal, Rajasthan and Karnataka are the States showing the maximum amount of growth in percentage share of the arriving passengers.
- Similarly, Maharashtra and Andhra Pradesh are States where the percentage share of total migrants has reduced.
- Mumbai,
- Bengaluru Urban,
- Howrah,
- Central Delhi,
- Hyderabad
- The above are the districts that are attracting most migrant arrivals.
- Following are the top ORIGIN Districts:
- Valsad,
- Chittoor,
- Paschim Bardhaman,
- Agra, Guntur,
- Villupuram,
- Saharsa
- Popular State-to-State and district-to-district dyads (From X State/district to Y state or district)
- The State level dyads given below:
- Uttar Pradesh - Delhi
- Gujarat – Maharashtra
- Telangana - Andhra Pradesh
- Bihar – Delhi
- Following are popular district level dyads.
- Murshidabad – Kolkata
- Paschim Bardhaman-Howrah
- Valsad – Mumbai
- Chittoor - Bengaluru Urban
- Surat - Mumbai.
- A majority (>75%) of predicted migration flows are within 500 kms of the origin.
ODISHA MIGRATION STORY
As per Census 2011 migration data, the state had around 13 lakh out migrants. But Economic Survey 2016-17 calculation has estimated the number at around 20 lakh . Below is the table that shows top 10 destinations of migration from ODISHA in 2001 and 2011 census data.
- 2001 CENSUS
STATES | PERSONS | PERCENATGE SHARE |
CHHATTISGARH | 1.72 Lakh + | 18% |
WEST BENGAL | 1.58lakh + | 17% |
GUJARAT | 1.15lakh + | 12% |
ANDHRA PRADESH | 1.05 lakh + | 11% |
MAHARASHTRA | 91K+ | 10% |
JHARKHAND | 82K+ | 9% |
BIHAR | 43K | 4% |
DELHI | 20K+ | 4% |
UTTAR PRADESH | 20.8K | 2% |
KARNATAKA | 16.3K | 2% |
- CENSUS 2011
STATES | PERSONS | PERCENTAGE SHARE |
ANDHRA PRADESH | 1.8 lakh + | 14.6% |
GUJARAT | 1.7Lakh + | 13.8% |
CHHATTISGARH | 1.5lakh+ | 12% |
WEST BENGAL | 1.4lakh+ | 11% |
JHARKHAND | 1.26Lakh | 9.9% |
MAHARASHTRA | 1.14Lakh | 9% |
KARNATAKA | 64K+ | 5% |
DELHI | 41K+ | 3.2% |
UTTAR PRADESH | 35K+ | 2.8% |
TAMIL NADU | 22.8K | 1.8% |
- PMEAC 2023 DATA: The 2023 migration estimates are not based on any census data. Rather, the PMEAC team had drawn the hypothesis by taking into account the percentage share of travel from Odisha by citizens of the State availing the unreserved tickets of Indian railways.
- % SHARE OF ARRIVALS TO OTHER STATES FROM ODISHA (The states may not be the destinations)
STATES | PERCENTAGE SHARE |
ODISHA | 44% (shows high intra state migration) |
CHHATTISGARH | 12.2% |
JHARKHAND | 10.22% |
ANDHRA PRADESH | 5.8% |
PONDICHERRY | 5.46% |
WEST BENGAL | 4.66% |
TELANGANA | 1.8% |
GOA | 1.85% |
TAMIL NADU | 1.6% |
GUJARAT | 0.94% |
MAHARASHTRA | 0.34% |
DESTINATIONS OF MIGRANTS FROM ODISHA: This table shows which state harbours maximum Odia migrants
STATES | PERCENTAGE SHARE |
ODISHA | 44% |
WEST BENGAL | 13.28% |
ANDHRA PRADESH | 12.93% |
JHARKHAND | 8.7% |
CHHATTISGARH | 5.46% |
TAMIL NADU | 2.93% |
TELANGANA | 2.14% |
GUJARAT | 1.87% |
KARNATAKA | 1.59% |
MAHARASHTRA | 1.42% |
UTTAR PRADESH | 1.2% |
A glance at the PMEAC data above, and its comparative study with 2011 Census reveals the following.
- As per PMEAC, West Bengal is largest host to the migrants from State, but 2011 census had given this position to Andhra Pradesh.
- Andhra Pradesh hosts 2nd largest Odisha migrants, in 2011 census, Gujarat was no 2.
- In 2011, Chhattisgarh at 3rd place.
- But PMEAC 2023, data puts Jharkhand at No 3
- PMEAC puts Chhattisgarh at No 4.
- Gujarat placed at 8th position in PMEAC data
- Tamil Nadu and Telangana have seen increased flow of migrants from Odisha
50% ODISHA DISTRICTS PRONE TO MIGRATION
As per the map released by the PMEAC, as whopping over 50% of districts seem prone to migration (intra state or inter state). The State HQ Khurda has also been placed in the vulnerable list. (view the Map given below)

In another yardstick adopted by the PMEAC, where it has evaluated the ratio of savings account to current account, again over 50% districts figure in the top origin districts in the country.
Higher current account ratio indicates high economic activity.
Higher saving account ratio indicates outbound migration.
- In this yardstick, Nayagarh district has been outlined by the PMEAC as the district most vulnerable to migration, as the district figure among the highest savings to current account ratio districts in the country.. (View the map below).


